The illusive average
There is a saying, don’t cross a river that is four feet deep on average. The adage highlights the idea that averages can be misleading. It is certaintly the case in the stock market. From 1928 to 2025, the S&P 500 Index exhibited considerable variation in calendar year returns. From a high of 52.3% (1954) to a low of -47.1% (1931) and an average calendar year return of 11.7%, the below brick chart shows a wide range of outcomes in any given year.
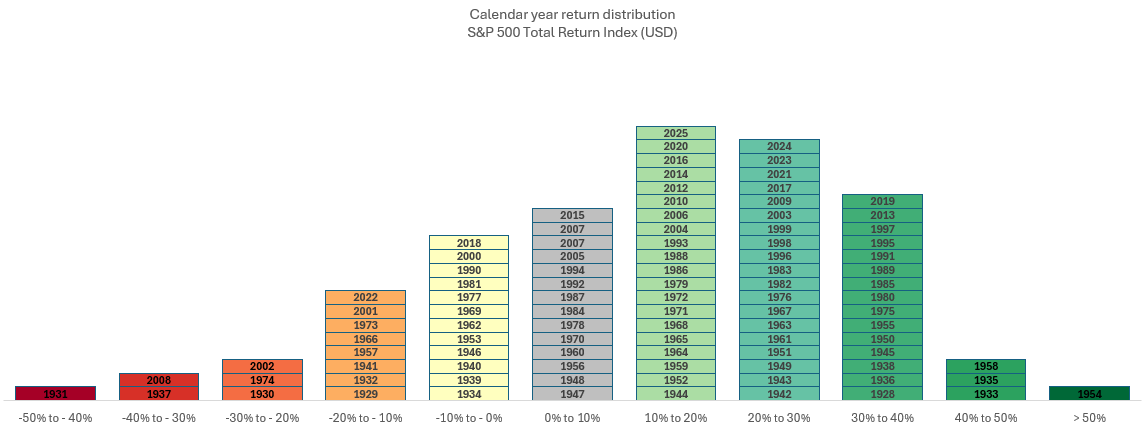
Source: Bloomberg LP. Calendar year returns. 1928-2025.
It is interesting to note there have been very few years where calendar year performance has fallen close to its long-term average. In fact, over our measurement period, the annual return have fallen within one percent of the average in just five years or barely five percent of the time:
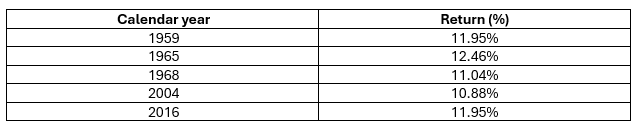
Source: Bloomberg LP. Calendar year returns. 1928-2025.
So we should take care when hearing pronouncements about average numbers. Like our river that is four feet deep on average, the stock market hides significant variation beneath its surface.
