Index concentration
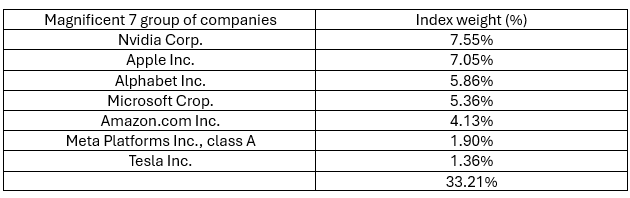
One of the most striking features of the S&P 500 Index in the last couple years is the large increase in market concentration. As of July 31, 2026, the Magnificent 7 group of companies made up one-third of the U.S. bellwether:
Source: Bloomberg LP. iShares Core S&P 500 ETF (IVV US). July 31, 2026.
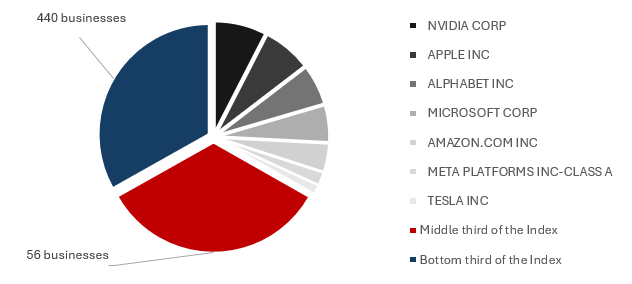
If we break the Index up into equal one-third parts, we can see that the remainder is composed of a bottom one-third of 440 companies, or more than 87 percent of the largest publicly traded companies in the United States, including household names such as AT&T, Boeing and Walt Disney. The middle one-third is 56 companies, among them industry stalwarts such as Johnson & Johnson, Visa and Walmart.
Source: Bloomberg LP. iShares Core S&P 500 ETF (IVV US). July 31, 2026.
The top 10 over time
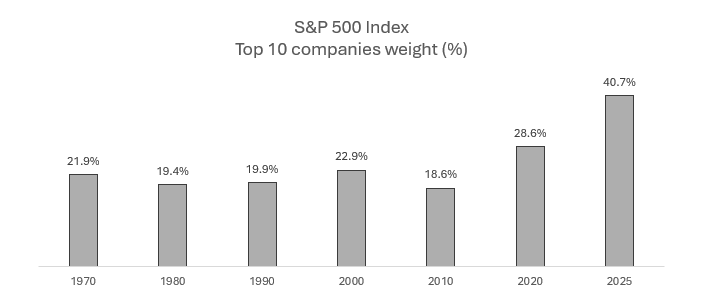
Looking back over the last several decades, we can see how unique the current period is in a historical context.
Source: Bloomberg LP. Market value weights taken from iShares Core S&P 500 ETF (IVV US) for December 31, 2010, 2020 and 2025. Market value weights for December 31, 1970, 1980, 1990 and 2000 were found here.
From year-end 1970 to year-end 2020, the top 10 companies in the S&P 500 Index have moved between a low of 18.6% (2010) and a high of 28.6% (2020) averaging 21.9% over the fifty-year period. In contrast, the top 10 holdings in the index as of year-end 2025 account for 40.7% of the total, or 86% more than the average over the preceding decades.
In Price and value, part 2, I noted that the Magnificent seven businesses were grouped together because they are leaders in technological innovation due to high-growth trends in artificial intelligence, cloud computing and digital infrastructure. We saw that these businesses are objectively expensive by historical standards as measured by trailing price-to-earnings, but the potential for a technological revolution led by these firms have allowed them to maintain their market leadership over the last few years.
What are investors to make of the current level of market concentration? Will the enormous capital expenditures on artificial intelligence infrastructure and data center buildout begin to bear fruit and justify the valuations these companies command, or will we look back on the current period as a case study in overspending that ultimately led to the bursting of the “AI bubble” similar to previous bubbles such as the Nifty-Fifty era of 1970s or the Dot-com period of the late 1990s?
A few words on market capitalization
What is market capitalization
Market capitalization, or market cap, is a widely used measure of company size based on its market value. It is calculated by multiplying the number of shares outstanding by the current price per share. For example, a company with 50 million shares outstanding and a share price of $100 per share would have a market capitalization of $5 billion. Market capitalization represents the market value of a company’s equity.
Why it matters
Market capitalization is commonly used to rank companies within major stock market indexes and to assess their relative size and influence on the index. In market capitalization weighted indexes, the largest companies have a disproportionate impact on the index’s performance and overall market concentration.
Changes in market capitalization reflect shifts in investor expectations, sector leadership and long-term market trends.
Most market indexes are market capitalization weighted including the S&P 500 Index, NASDAQ Composite Index, S&P/TSX Composite Index and MSCI World Index.
