Price and value, part 2
There’s no asset so good that it can’t become overpriced and thus risky, and few so bad that there’s no price at which they’re a buy.
Howard Marks, Investor and author
In Price and value, part 1 we discussed the relationship between price and value and highlighted some examples of speculative excess when prices diverged sharply from value. In part 2 we will review what can happen when market participants, failing to determine the intrinsic value of a company, invest at high prices. We will also look at where the broader market is today in a historical context.
Good company, bad investment
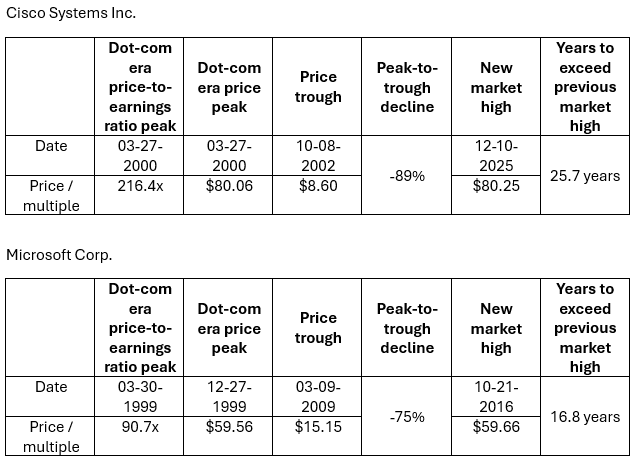
Cisco Systems develops manufactures and sells hardware, software, telecommunications equipment and other high-technology services and products focused on networking, cybersecurity and artificial intelligence. While Cisco is widely considered to be an industry leader, they are also a textbook example of how a good company can be a bad investment if the price you pay is too high.
When the Dot-com bubble peaked on March 27, 2000, Cisco Systems was also soaring. Its stock price had reached an all-time high of more than $80 per share which was 216 times the last 12 months earnings of the business. What followed was a crash of epic scale as the stock cratered 89% to $8.60 on October 8, 2002. As dramatic as the price decline was, an even bigger part of the story is how long the recovery took: the bubble-era price of $80 was only breached in December 2025, more than 25 years later.1
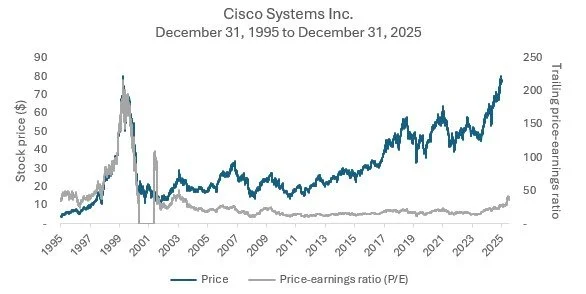
Source: Bloomberg LP. Stock price and trailing price/earnings ratio. 1996 – 2025.
Microsoft is a company that needs no introduction. Its products are so ubiquitous, from the Windows operating system that powers home and office computers and office productivity software such as Word, Excel and PowerPoint to cloud computing, video gaming and artificial intelligence tools, it is a company that has become synonymous with the computer age. While Microsoft the business is a success story by any definition, like Cisco it is a case study in how a great company does not always make a great investment if the price paid is too high.
While Microsoft’s bubble-era stock price peaked at $59.56 on December 27, 1999, its trailing price-to-earnings multiple peaked nine months earlier at 90 times earnings on March 30, 1999. Investors had plenty of time to consider the lofty valuation but if they ignored what the market was telling them, they suffered a 75% decline from the market peak which only ended on March 9, 2009. Like Cisco, Microsoft’s stock price took many years to reach its previous high only exceeding it more than 16 years later on October 21, 2016.
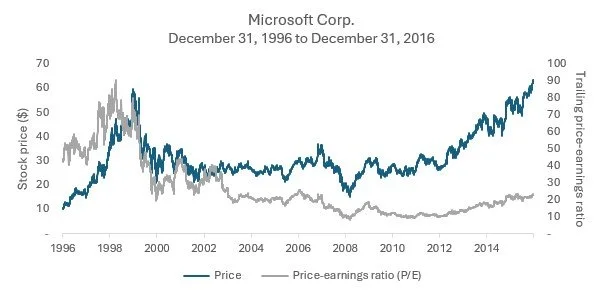
Source: Bloomberg LP. Stock price and trailing price/earnings ratio. 1997 – 2016.
Cisco Systems and Microsoft are cautionary tales of good companies turning into bad investments if you invest at lofty valuations. Now let’s look at where the broader market is at the half-way mark of the 2020s.
Some market history
The current market is expensive by historical standards. As of December 31, 2025, the S&P 500 Index was trading at 25.6 times its expected future earnings. On this basis, the dot-com era was the only period in modern history when the S&P 500 was more expensive than it is today.
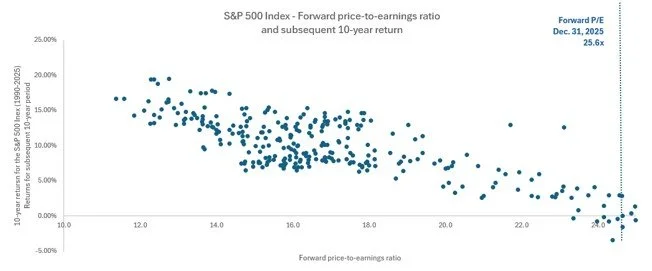
Source: Bloomberg LP. Index value (including dividends) and forward price/earnings ratio. 1990 – 2025.
The graph illustrates a general rule of investing that the higher the price you pay, the lower your prospective return will be, all else being equal.
If we take a deeper look at the S&P 500 Index today, we see that a full one-third of the Index is made up of just seven companies. These mega-capitalization businesses are known as the Magnificent 7 and trade at an average price of 71.3 times trailing earnings. Even if we exclude Tesla, the obvious outlier, we get an average price of 32 times trailing earnings. This is more than 25% higher than the overall S&P 500 Index which is itself expensive by historical standards.
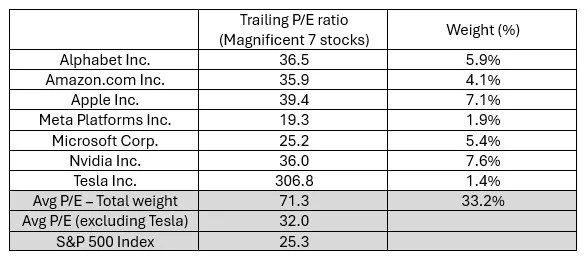
Source: Bloomberg LP. Magnificent 7 trailing price/earnings ratio and weight in the S&P 500 Index. Weights are for the iShares Core S&P 500 ETF (IVV US). July 31, 2026.
We can see that the S&P 500 Index today is expensive by historical standards, that one-third of the index is weighted in just seven businesses, these seven stocks are being buoyed by the theme of technological innovation as well as high-growth trends of artificial intelligence, cloud computing and digital infrastructure and that investors that buy at high valuations have historically experienced mediocre returns over the subsequent 10-years.
What this means for investors
A good company can be a bad investment if the price you pay is too high and a bad company can be a good investment if the price is low enough.
The higher the price you pay for an asset, the lower your prospective return will be.
Investors need to consider the price they pay when making an investment.
Appendix
Source: Bloomberg LP.
