Price and value, part 1
Price is what you pay, value is what you get.
Warren Buffett, Chairman, Berkshire Hathaway, Inc.
One of the most important but poorly understood concepts in investing is the distinction between price and value. In equity investing, a stock price is the current trading cost for a share of a publicly listed company. Prices are readily observable, but fluctuate constantly based on news, economic cycles and market sentiment. In contrast, value, or intrinsic value in investment parlance, is defined as the calculated worth of a company’s fundamentals such as profit margins, cash flows and earnings. While prices are known to everyone and therefore objective, intrinsic value is a subjective estimate because no two investors will assign an identical value to a business. The difference between price and value is the subject we will discuss here.
A thought experiment
It is a fundamental economic principle that, all else being equal, as the price of a good or service increases, the quantity demanded for that good or service decreases. Conversely, as the price decreases, the quantity demanded increases. This is referred to as the law of demand and is intuitive to consumers everywhere.
Whether you are buying a cup of coffee, a pair of shoes or a Ferrari, we have a conceptual understanding that the price of a cup of coffee is about $2, a decent pair of shoes can be had for $200 and the price of a Ferrari ranges between $250,000 to $600,000 in Canadian dollars. We understand that these prices approximate each good’s fair value. However, if the next time you were at your local Tim Hortons the coffee was being sold for $20, you would know that something had gone seriously wrong. The price would have diverged sharply from value, and you would go back to making your coffee at home. Similarly, if you were shopping for a new car, and noticed the price of a Ferarri had been drastically reduced and was now selling for $25,000, you would know that a bargain was available, and you might unexpectedly find yourself in the luxury car market.
There is one curious exception to this principle which can be found in the stock market. When a stock is increasing in price, investors tend to want more of it and when it is decreasing in price investors tend to want it less – a direct contravention of the law of demand. One hypothesis for this counterintuitive result is that, unlike the markets for coffee, shoes and Ferraris, many investors might not have a good understanding of the value of the stocks they own. Instead, they closely follow stock price movements, and when the momentum of a stock is moving upwards, they buy more of it hoping it will continue its upward trajectory. Conversely, when the momentum of a stock is moving downwards, they sell hoping to limit their losses.
The result of this perplexing situation is that stock price movements can become self-fulfilling prophecies where prices deviate sharply from value as herd mentality sets in giving rise to both speculative bubbles on the upside and large drawdowns on the downside. While the drawdowns can make for instructive investing case studies, this white paper will focus on speculative bubbles of which there are a number of salient examples.
Irrational exuberance
The Nobel Prize winning economist Robert Shiller popularized the term irrational exuberance in his examination of speculative bubbles. In his book by the same name, Shiller states:
“Irrational exuberance is the psychological basis of a speculative bubble. I define a speculative bubble as a situation in which news of price increases spurs investor enthusiasm, which spreads by psychological contagion from person to person, in the process amplifying stories that might justify the price increases, and bringing in a larger and larger class of investors who, despite doubts about the real value of an investment, are drawn to it partly by envy of others’ successes and partly through a gamblers’ excitement.”1
Tulip-mania
The first recorded speculative bubble occurred in 1630s Holland during a golden age for the Dutch Republic which was a leading economic and financial power in the 17th century. During the period which would become known as Tulip-mania, the most expensive tulip bulb, the Semper Augustus, sold for 10,000 guilders, the Dutch currency prior to creation of the euro. It was enough to feed, clothe and house a whole Dutch family for half a lifetime, or sufficient to purchase one of the grandest homes on the most fashionable canal in Amsterdam.2
At its zenith the tulip craze took hold of all levels of Dutch society. Charles Mackay, in his definitive chronicle of the period, wrote that the wealthiest merchants to the poorest chimney sweeps jumped into the tulip fray, buying bulbs at high prices and selling them for even more.3
Tulip-mania became a model for the general cycle of financial bubbles:
In the beginning, investors lose track of rational expectations as price momentum builds.
Psychological biases including the fear of missing out (FOMO) lead to a large upswing in asset prices.
A positive feedback loop takes hold as prices continue to inflate.
Eventually investors realize they are holding an irrationally priced asset.
In the end, prices collapse due to massive sell-off as holders attempt to unload their asset at any price.
While Tulip-mania may have been the first documented example of speculative excess, it would not be the last. Modern examples include the Nifty-Fifty bubble of the 1970s, the Dot-com bubble of the late 1990s, and more recent examples including markets for non-fungible tokens (NFTs), meme stocks and cryptocurrencies. Let’s look at the Dot-com bubble as a case study.
Dot-com bubble
The Dot-com bubble was a historic stock market bubble that developed during the late 1990s and peaked on March 27, 2000. The growth in the market was driven by the widespread adoption of the World Wide Web and the Internet, which resulted in a flood of venture capital investment and the rapid growth of valuations in new dot-com startups. Between August 1995 and its peak in March 2000, the tech-heavy NASDAQ Composite Index rose 718 percent, only to fall 83% by October 2002.
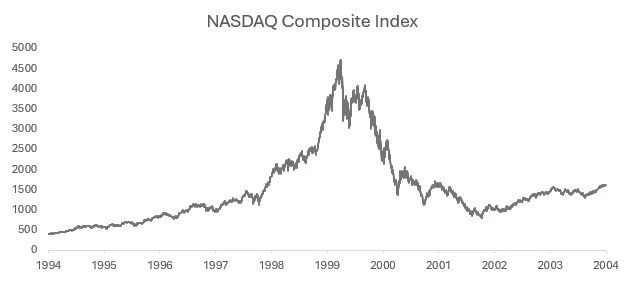
Source: Bloomberg LP. The dot-com bubble is measured from August 9, 1995, with the initial public offering of Netscape Communications, a pioneering search engine provider to March 27, 2000, when the NASDAQ Composite Index hit its bubble-era peak. The bursting of the bubble is measured from the market peak to its lowest point on October 7, 2002. NASDAQ Composite Index (USD).
Dot-com businesses famously raised massive amounts of capital despite the absence of viable business models. A few of the most notorious examples include:
Pets.com: The online pet supply retailer raised over $80 million in an IPO but was bankrupt within nine months. Their downfall was precipitated by attempting to ship bulky, low-margin items like dog food while spending heavily on marketing.
Kozmo.com: A delivery service that promised to bring small items like movies and snacks directly to customers’ doors within an hour for free. The bad economics caused the company ceased operations in 2001.
eToys.com: An online toy retailer that capitalized on the holiday shopping rush but collapsed into liquidation in March 2001. They failed because expenses ballooned, and their nascent online infrastructure failed.
Like Tulip-mania before it, the dot-com bubble was clear case of price / value divergence as the bubble inflated and price / value convergence when the bubble eventually burst.
It has been said that history doesn’t repeat but it does rhyme. For this reason, it can be helpful to have some understanding of financial market history. Tulip-mania, the Nifty-Fifty bubble, and the Dot-com bubble can be instructive when trying to understand the potential for speculative bubbles in the present day.
What this means for investors
Consumers have an intuitive understanding of value for goods and services and act according to the law of demand in those markets. However, investors can misunderstand value, at least temporarily, and act in contravention to the law of demand in financial markets.
Speculative bubbles can arise in financial markets and are characterised by cycles where investors lose track of rational expectations, psychological factors consume market participants and positive feedback loops cause bubbles to inflate as irrational exuberance takes hold.
In financial markets, price and value can diverge, sometimes for extended periods of time. Price and value always converge in rationally priced markets.
References
Robert Shiller, Irrational Exuberance.
Mike Dash, Tulipomania: The Story of the World’s Most Coveted Flower and the Extraordinary Passions It Aroused.
Charles Mackay, Extraordinary Popular Delusions and the Madness of Crowds.
